We've talked about performance tools and web vitals. So you know how to measure performance and what the metrics are telling you. Now comes the hard part, how do you improve them?
Lighthouse will give you some hints in particular cases, but the more complex your site, the less helpful those can be. After the baseline optimizations, what's next?
The calculator
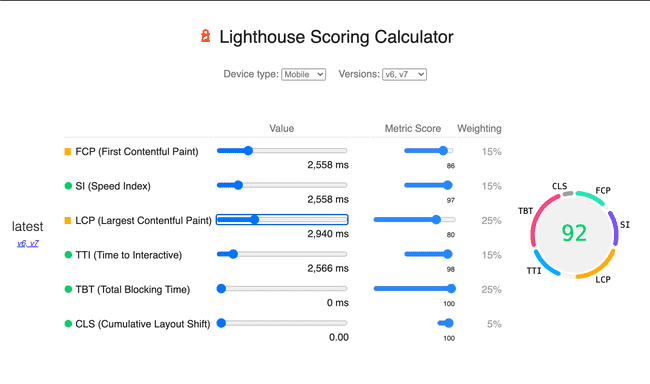
The first thing to know is that your overall performance score is based on a balance of the three core web vitals (and some other metrics). In devtools, Lighthouse gives you a calculator that allows you to adjust these values and see the resulting overall score.
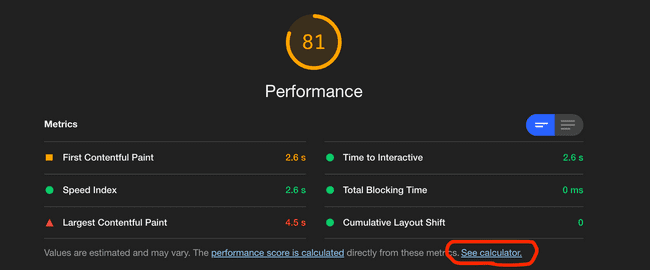
To access the calculator run a Lighthouse audit and scroll to the Performance section.

It will open up the calculator so you can start moving metrics around and get an idea of what to balance in order to improve your performance score.

You'll notice in this calculator that some of the metrics have little impact -- something like speed index for example. Others can only be optimized so much. But it's a great starting point to help direct you to your biggest performance challenges.
Recording
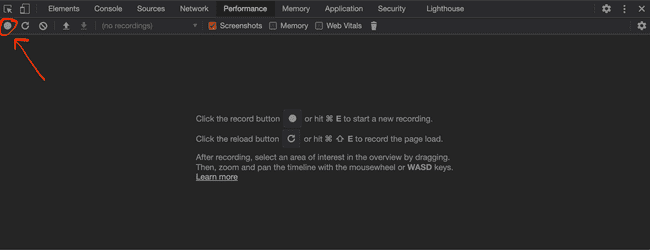
The next thing you want to do is record performance. You can do this in devtools.

Some recommendations:
- use incognito mode
- use a clean chrome profile
- use chrome canary (this will show you core web vitals in your recording)
After pressing record, be sure to refresh your site to get an example of the page load experience and the metrics you're looking for.

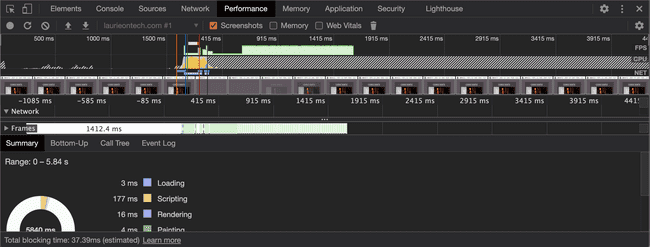
Once you've got your recording you can see how the page render changes in milliseconds. You're going to look for long-running tasks, or tasks that trigger reloads, etc.
Mitigation
Many of the mitigation solutions are issues developers have been focused on for a long time. That's because, even though the core metrics are newer, the challenges they highlight and index on are the same.
Addressing FID (estimated using TBT)
First Input Delay (FID) is a core web vital, but as we explained in the last post, it's often estimated using Total Blocking Time (TBT), and sometimes Time To Interactive (TTI). So these mitigation efforts are focused on improving TBT.
Long hydration or rendering
This is for all you React users out there! The virtual DOM is a wonderful tool, but it requires some extra handling when code arrives in the browser. Hydration (or rendering) blocks the main thread from executing other tasks. Exactly what TBT is designed to estimate and warn you about.
So how do you address it? There are options!
Lazy load what you can. Is it rendering below the fold? Is it code that will only run when a form is submitted? Is it code that will only appear when the mobile nav is open? Reduce that code from your main bundle where you can. I have a post on code splitting if you're curious about getting started.
Make use of things like setTimeout. Do a little bit less and let your browser breathe! Browsers are smart, if you can stagger what they need to focus on, they'll get the job done.
Finally, pay attention to that virtual DOM. Complexity does matter because a more complicated DOM tree takes longer to hydrate. Excessively nested providers and context for every element on the page is an anti-pattern.
Re-calc
Did you see a whole cascade of changes in your recording and notice that there was a very small, blink and you'll miss it, re-calc block at the start of it? This is a big one because it affects TBT and has some impact on CLS as well.
One of the triggers for re-calc is using code to measure the DOM. Making style changes or creating new elements hurts performance. However, even reading from the DOM can have an impact, because it's blocking in the viewport.
To address this be mindful of how you make changes. If you're updating CSS it's better to change an inline style rather than a style block. This makes sense because adjusting an inline style changes a single element where as a style block change forces the browser to check the entire DOM tree for potential changes.
When it comes to CSS animations, they can be expensive. Ideally, you should only use animation on opacity changes or transforms. Those CSS properties don't involve layout changes, so it's cheaper. It's also recommended to use transform3d or willChange instead of transformX or transformY. Finally, try and avoid modifying these properties in animations or events. If you're working with a small DOM this matters less.
Outside of CSS, avoid these JavaScript calls. If you have to use them, do so inside a requestAnimationFrame. You'll want to use the useLayoutEffect hook to prevent excessive calls. You'll always want to read then write. And never read and write in the same request as it will re-calc twice.
Finally, make use of requestIdleCallback for anything that doesn't have to be there for user experience. If it can wait, it should. Whatever is inside a requestIdleCallback gets called when the browser isn't busy. It's loaded but hidden until someone interacts with it. This is a great solution for single page apps where you hover over something. Read this post to learn more.
Long paint times
Another impact to TBT is long paint times. This mostly occurs when you have a large and complex DOM. Note that this is not the same as a large virtual DOM, though one can imply the other.
To address this issue simplify your HTML structure. div soup is bad. Also note that inline SVGs can be expensive! Especially if they're complicated. If you're using an SVG for a small or otherwise fixed size image, it probably makes sense to convert it to another format.
Another way to improve this score is the CSS property content-visibility. However, as Marcy Sutton notes in her article, use this with caution. Using it on landmarks is harmful to accessibility.
Finally, try to stay away from excessive use of box-shadow or heavy CSS filters. They're expensive when you have a lot of them.
Addressing CLS
The next core web vital to handle is Cumulative Layout Shift (CLS). Unlike FID, there aren't a ton of things that impact this. In fact, other than re-calc, which we mentioned above, there is one main culprit.
re-layout
Your CLS is bad when your layout shifts. This can only happen if you're laying your page out more than once. Many pages do this, but you can limit the number of times it happens and ensure that it doesn't result in significant visual shifts.
Changing styles or inserting elements causes a re-layout. If there is another way to accomplish what you're trying to do without using those methods, please do!
Placeholders are your friend. If you're loading something that takes time to render, like an image, having an element in the DOM that matches those dimensions can prevent the page from a large layout shift when it renders.
If you're lazy loading a font, try and match it with a system font that is similar. Fonts can cause significant shifts. It's also good to make use of font swap.
Addressing LCP
The last core web vital is Largest Contentful Paint (LCP). Time to talk about asset optimization!
Image or font loads
Ensuring your images and fonts load performantely is the main way to improve LCP as those assets are typically the largest on your site.
For your main image, load it from your own domain. Loading it from a third party source will often be slower.
For fonts, add a preload tag. Then the browser can optimize this download for you.
Downloads that block rendering
There are also a number of things that can block rendering of these larger assets. Mainly, blocking scripts, loading stylesheets, and non-async script tags.
If you're inlining scripts make sure they're at the bottom of your file. When the browser parses the DOM, each time it encounters a script, it has to stop and wait for it to run. Putting that script at the bottom the file ensures the DOM parsing is not blocked.
Marking scripts with type module also prevents them from blocking rendering.
Finally, make sure your stylesheet is included before any script tags. When the browser finishes parsing the DOM it needs access to the CSSDOM in order to create the render tree. If it's blocked from accessing the stylesheet it can't do that, further delaying the page render.
And that's it!
You're probably thinking, what do you mean "that's it"?!? That was a lot! And you're absolutely right.
It's worth noting that many of these optimizations won't apply to your page. But for the ones that do, you aren't looking to eliminate every re-calc or prevent the need to download your large assets. These behaviors are necessary for an awesome, dynamic site. The goal is to minimize their impact on user experience and handle them in the most performant way.

